Pull up two listings side by side this week: a two-bedroom conversion off West Broadway in South Boston running somewhere in the $800 to $1,100 per square foot range, and a two-bedroom at Echelon Seaport or 22 Liberty running $1,800 or more per square foot. Same T stop within a few minutes' walk of each other. Same harbor air. A price gap that can run $300,000 or more on comparable square footage.
The easy explanation is location: Seaport is newer, shinier, closer to the restaurants and the Institute of Contemporary Art, so it costs more. That explanation isn't wrong, but it's incomplete in a way that matters if you're the one writing the offer. The gap between these two neighborhoods right now has less to do with the ten-minute walk across the Fort Point Channel and more to do with two things buyers rarely think to ask about until they're already under agreement: what year the building went up, and what's sitting in its reserve account.
Two Different Products Wearing One Zip Code Comparison
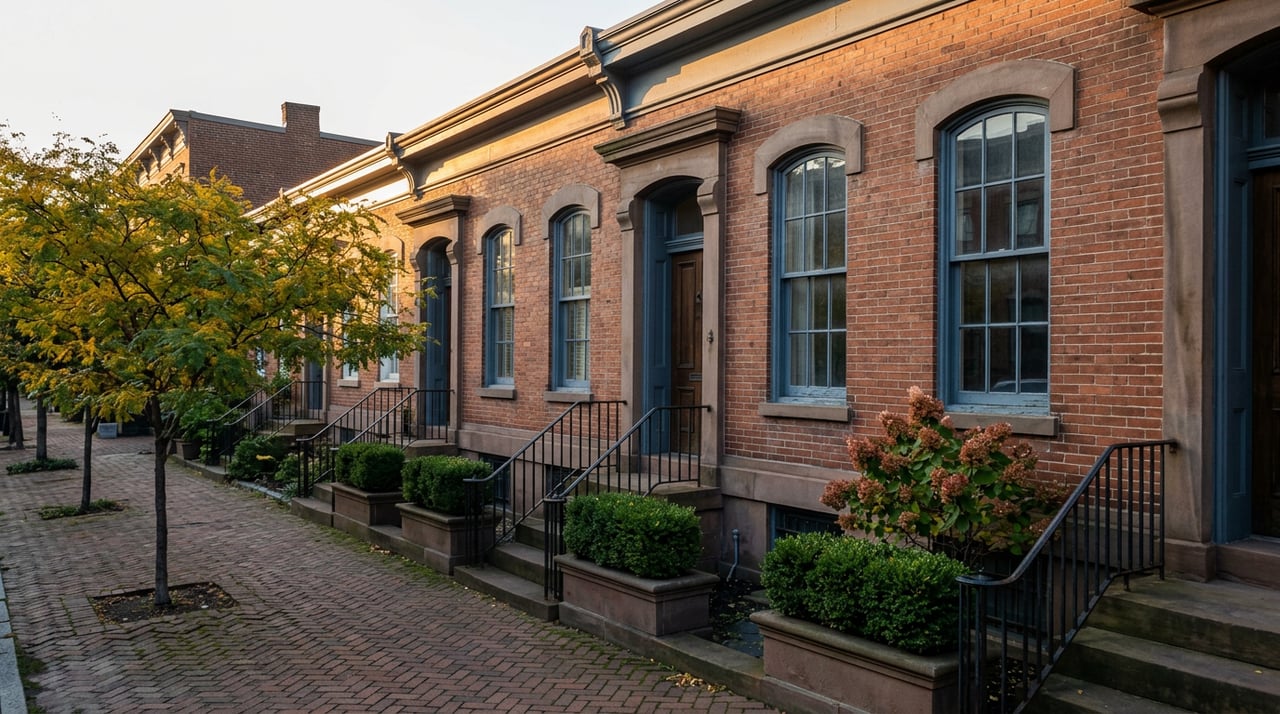
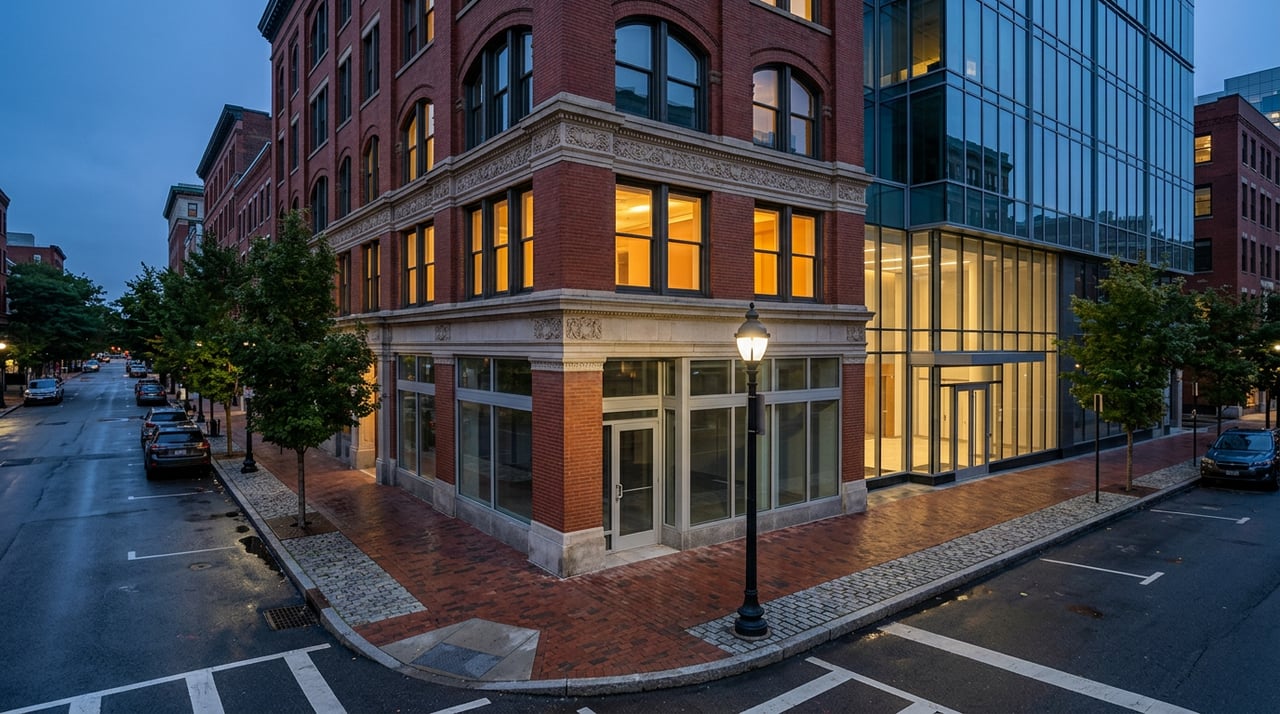
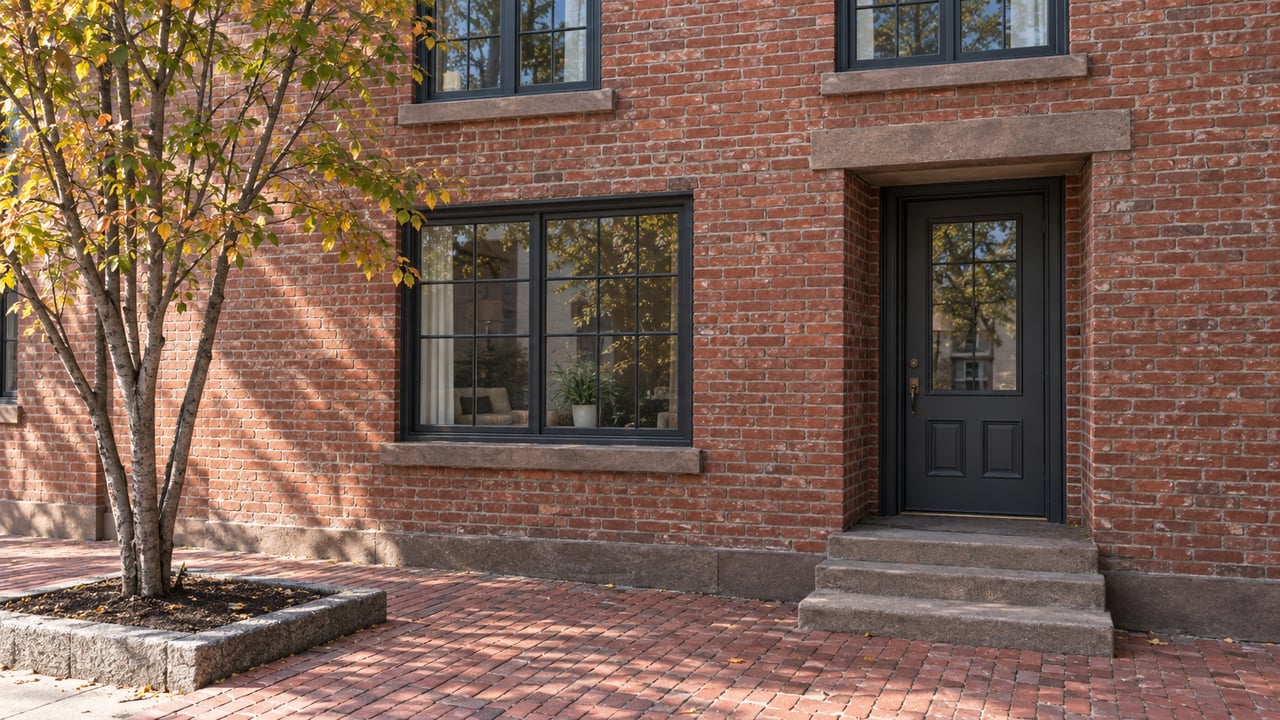
South Boston's condo stock is still substantially made up of triple-decker and wood-frame rowhouse conversions along corridors like West Broadway, M Street, and K Street, buildings that started life as three-family homes and got carved into individual units over the past few decades. Seaport, by contrast, is almost entirely new-build. There's no equivalent of a 1900 triple-decker in the Seaport core. The oldest thing there is younger than most Seaport condo owners.
That single fact explains more of the price spread than the neighborhood name does. A converted triple-decker unit typically comes with a small, self-managed HOA and modest monthly fees, sometimes in the low $200s a month based on recent South Boston listings. A full-service Seaport tower with a lobby staff, a fitness center, and a parking garage carries fees that can run into four figures a month once you account for the building's full amenity package. You're not just buying square footage in either case. You're buying into two entirely different cost structures that happen to sit a few blocks apart.
Here's how the two neighborhoods compare on the numbers that actually distinguish them, based on recent 2026 reporting:
| South Boston | Seaport | |
|---|---|---|
| Typical price per square foot | $800–$1,100 | $1,500–$2,200+ |
| Typical building era | Early-to-mid 1900s conversions, some newer mid-rise | Almost entirely post-2010 construction |
| Monthly HOA range | Low hundreds for smaller conversions | High hundreds to several thousand for full-service towers |
| Recent market pace | Median condo price near $1.05 million, up modestly year over year | Year-to-date average condo sale near $2.59 million across 29 closings |
| Supply condition | Tighter, competitive | 12.9 months of supply, a buyer's market |
That last row is where the story gets more interesting than a simple discount narrative.
The Seaport Side of the Trade Is Softer Than the Sticker Price Suggests
If you're comparing these two neighborhoods purely on the assumption that Seaport buyers are paying more and getting more, the current data complicates that. Seaport's own recent market report shows condos closing at an average of 95.5 percent of list price year to date, down from 97.8 percent a year earlier, with an average of 74 days from listing to an accepted offer. Supply sits at roughly 12.9 months, which reads as a buyer's market by any conventional measure. In the first 60 days of 2026, close to a third of active Seaport listings saw a price reduction before going under agreement.
The clearest example of what that softness looks like at the building level is the St. Regis Residences, where roughly a third of the building's 114 units reportedly sat unsold before the project was taken back by its lender in early 2026. That's not a story about the neighborhood losing its appeal. Seaport still commands the highest per-square-foot pricing in the city and still closes multimillion-dollar sales regularly. But it's a reminder that the premium buyers pay for new construction and hotel-grade amenities is being tested right now in a way it wasn't two years ago, and a buyer paying Seaport prices in late 2026 is not automatically buying into a market moving in one direction.
South Boston, meanwhile, has kept its pricing steadier. Appreciation has slowed to a modest pace, but the segment hasn't seen the kind of inventory buildup or price-cut pattern showing up across the channel. That doesn't make South Boston the safer bet in every case. It makes the comparison less about which neighborhood is winning and more about which risk profile a buyer is actually signing up for.
The Real Discount Is in the HOA Minutes, Not the Listing Price
The part of this comparison that catches people off guard isn't the headline price gap. It's what determines whether that gap holds up after closing.
A converted triple-decker with a three-unit association and a few hundred dollars in monthly fees can look like the obvious value play next to a Seaport tower's four-figure HOA bill. But older, self-managed associations are exactly the kind of building where a reserve study hasn't been done in years, and where a roof, boiler, or facade repair can turn into a special assessment that lands on owners all at once rather than getting smoothed into the monthly fee over time. A full-service Seaport building's higher fee is, in part, the cost of professional management and a funded reserve account that's supposed to absorb exactly that kind of surprise.
Reading three years of HOA meeting minutes and the most recent reserve study before writing an offer isn't a formality in this comparison. It's the difference between a $200-a-month fee that stays $200 a month and one that comes with a $15,000 special assessment letter eighteen months after closing. The same due diligence applies in reverse in Seaport: a high HOA fee doesn't guarantee a well-funded reserve, and a building working through a lender takeback like St. Regis Residences is worth extra scrutiny on exactly this point.
South Boston Isn't One Market Either
The comparison so far treats South Boston as a single neighborhood, but the walk and transit numbers inside it vary more than the median price suggests. Addresses along West Broadway score around 92 for walkability and 85 for transit, putting them close to Broadway Station on the Red Line. Move toward Andrew Square and those numbers drop to roughly 86 and 69. City Point, the quieter residential pocket near Castle Island and M Street Beach, comes in closer to 82 and 52.
That range matters because a buyer choosing South Boston for the Seaport-adjacent commute is making a different decision than a buyer choosing South Boston for Castle Island and a slower pace. Both are real reasons to buy in the neighborhood. They point to different blocks, different building stock, and in some cases a meaningfully different price per square foot within the same zip code.
What This Means If You're Comparing the Two
The price gap between South Boston and Seaport is real and it isn't closing anytime soon. But treating it as a simple discount misses what's actually driving it. You're weighing building age against new construction, a modest self-managed HOA against a fully staffed one, and a steadier South Boston market against a Seaport market currently working through softer sale-to-list ratios and at least one high-profile building in distress. None of that makes one neighborhood the better buy in the abstract. It makes the reserve study and the HOA minutes just as relevant to the decision as the price per square foot on the listing sheet.
A few questions worth settling before you write an offer:
Does a lower price per square foot in South Boston always mean lower total monthly cost? Not necessarily. A well-run association with a healthy reserve can end up costing less over time than a cheap fee that gets wiped out by a special assessment. Compare total carrying cost, not just the sticker HOA number.
Is the current Seaport softness likely to last? The data reflects year-to-date 2026 conditions, including elevated months of supply and a lower sale-to-list ratio than a year earlier. Conditions in a market this concentrated in luxury new construction can shift quickly with even a few large closings, so treat any single month's snapshot as a point in time rather than a permanent trend.
Does building age tell you everything about reserve health? No. Some older South Boston conversions are meticulously maintained with healthy reserves, and some newer buildings underfund theirs in the early years. The building's actual financial documents matter more than its year of construction.
Comparing South Boston and Seaport on price alone tells you which neighborhood costs more. Comparing the building documents tells you what you're actually buying. If you're weighing a specific address in either neighborhood and want a second set of eyes on what the HOA minutes and reserve study actually say, Joe DeAngelo can walk through the numbers with you before you write the offer.